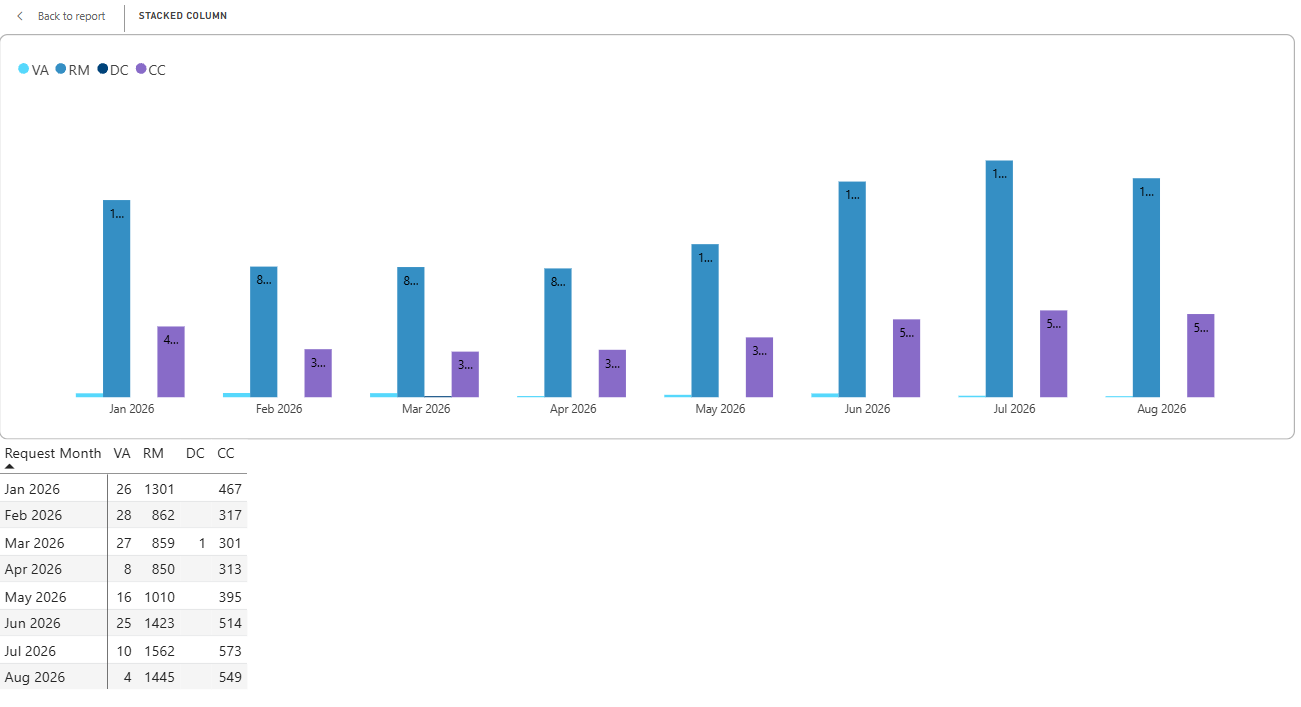
Payment Profiling
Overview
Payment Profiling provides flexible reporting and analytics capabilities for transaction data. Users can configure reports, apply filters, select different visualizations, and export the resulting data for further analysis.
Report Configuration
Report configuration allows users to tailor report output by selecting the appropriate hierarchy and entity level, defining reporting periods, applying filters, choosing reporting dimensions, and adding additional columns for more detailed analysis.
Figure 2: Entity selection and reporting filters

Entity Selection
Entity selection defines the reporting scope for the report. Users can select the hierarchy and entity level for which transaction data should be analyzed. Available entities depend on the user's position within the organizational hierarchy and assigned access rights.
- PSP
- Division
- Merchant
- Channel
After selecting the required entities, users can further refine the analysis using reporting filters and dimensions available in the report toolbar.
Date Range
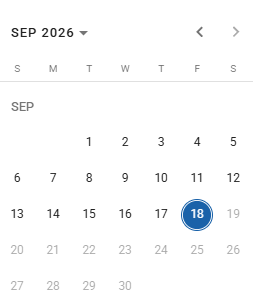
The date range selector defines the reporting period used for all displayed results. Select the required reporting period to refresh and analyze the corresponding transaction data.
Figure 3: Date range selection
Refresh
After changing report settings or filters, select Refresh to reload the report with the latest available data.
Bookmarks
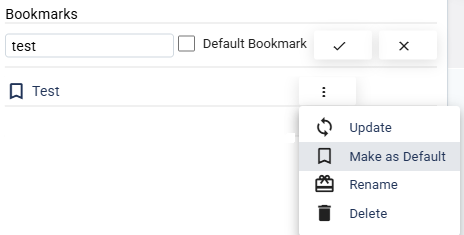
Bookmarks allow users to save frequently used report configurations for quick access. Saved bookmarks can be updated, renamed, deleted, or designated as the default report view.
Figure 4: Bookmark management
Filters
Filters help narrow the report dataset and focus analysis on specific transactions, entities, or business criteria.
Currency Filter
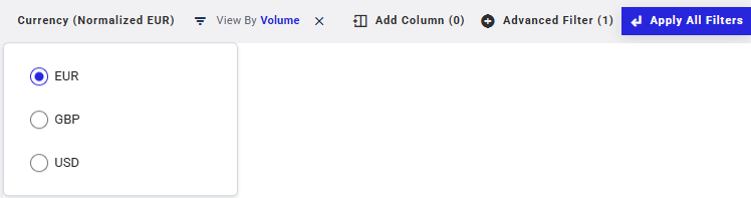
The Currency filter determines the currency used for report calculations, visualizations, and displayed values throughout the report.
- Currency (Normalized EUR) converts transaction amounts to a normalized EUR value, enabling consistent analysis and comparison across multiple merchant accounts operating in different currencies.
Figure 5: Currency filter
View By
The View By option determines how report data is aggregated and displayed. Users can switch between Volume and Value views depending on whether they wish to analyze transaction counts or transaction amounts.
Figure 6: View By options

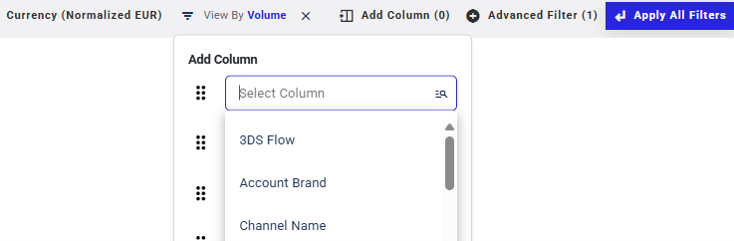
Add Column
Use Add Column to include additional reporting attributes in the report output. Available columns depend on the selected dataset and may include dimensions such as account brand, channel name, consumer brand, 3DS flow, and other transaction attributes.
Figure 7: Add Column
Advanced Filters
Advanced Filters allow users to refine report results by defining one or more filter conditions. Multiple filters can be combined to narrow the dataset to specific business criteria.
Figure 7: Advanced Filter configuration
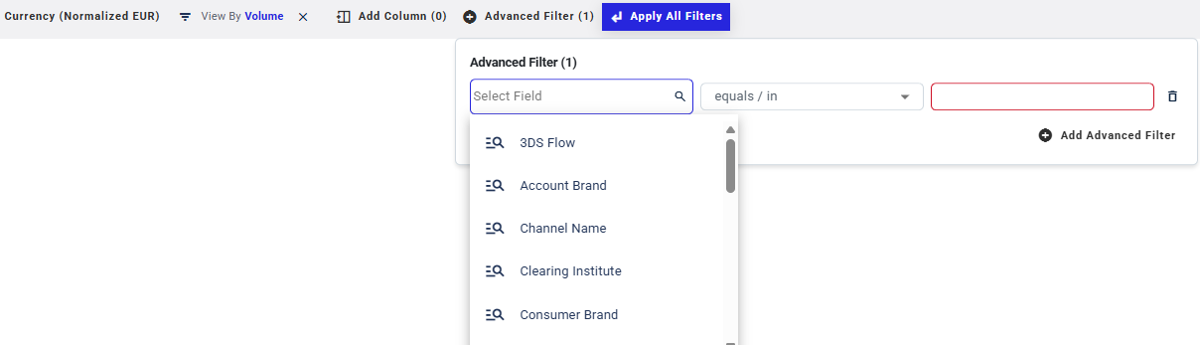
Figure 9: Advanced Filter with multiple conditions
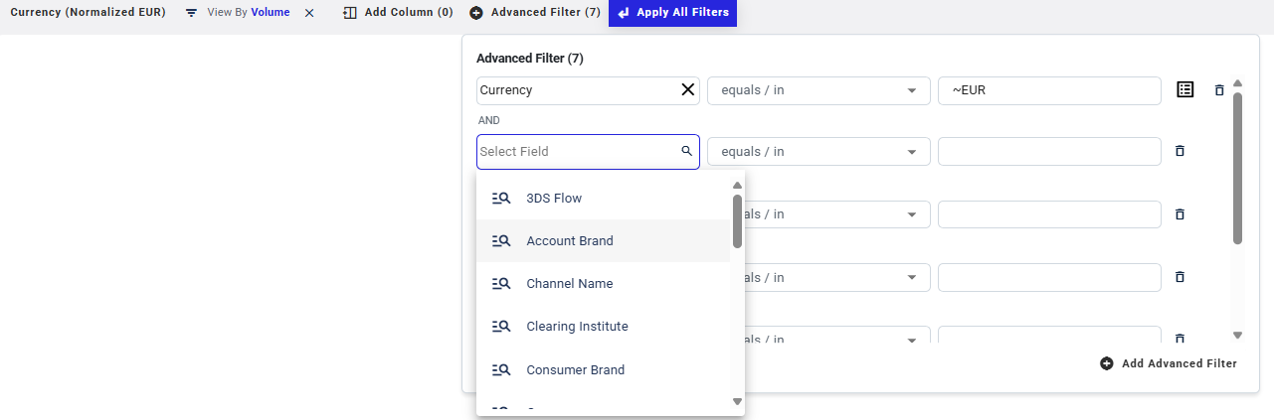
After configuring report parameters and filters, select Apply All Filters to update the displayed results.
Table View
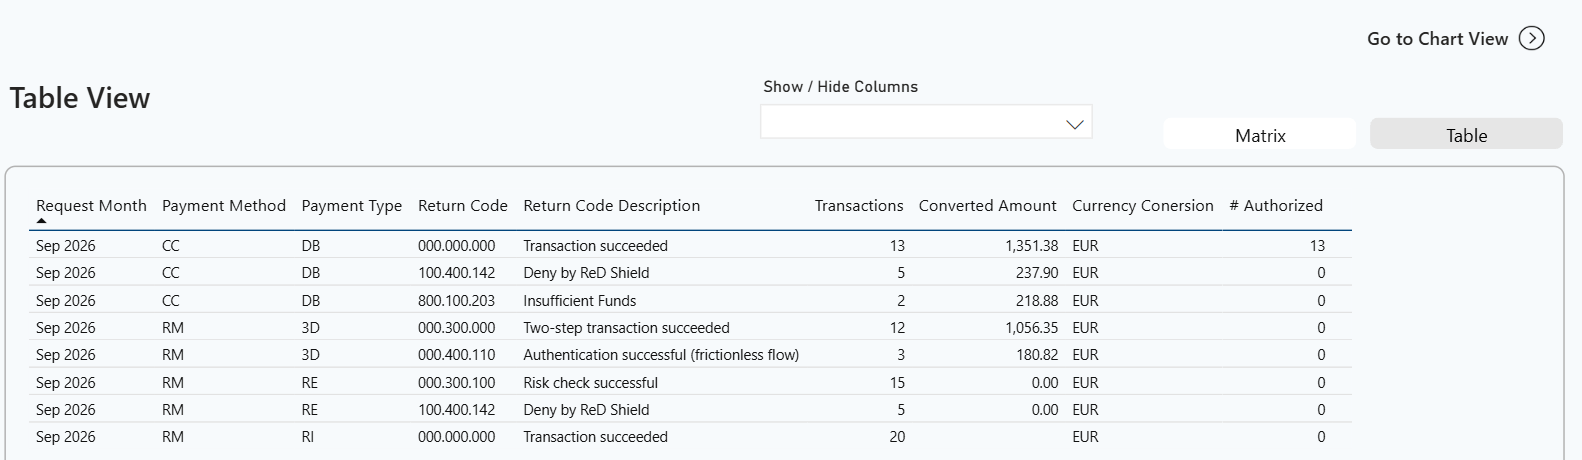
Table View presents report results in a tabular format and supports detailed analysis of transactions and performance indicators.
Figure 10: Table View
Show / Hide Columns
Use Show / Hide Columns to customize the displayed report metrics and focus on the information most relevant to the analysis.
Figure 11: Show or Hide Columns

Matrix View
Matrix View presents report data in a hierarchical structure and supports drill-down analysis through expandable and collapsible levels.
Figure 12: Matrix View
.png)
Chart View
Chart View provides graphical representations of report data. Users can configure different dimensions and switch between supported visualization types.
Use Dimension 1 and Dimension 2 to define how data is grouped and compared within the selected visualization.
Figure 13: Column chart visualization
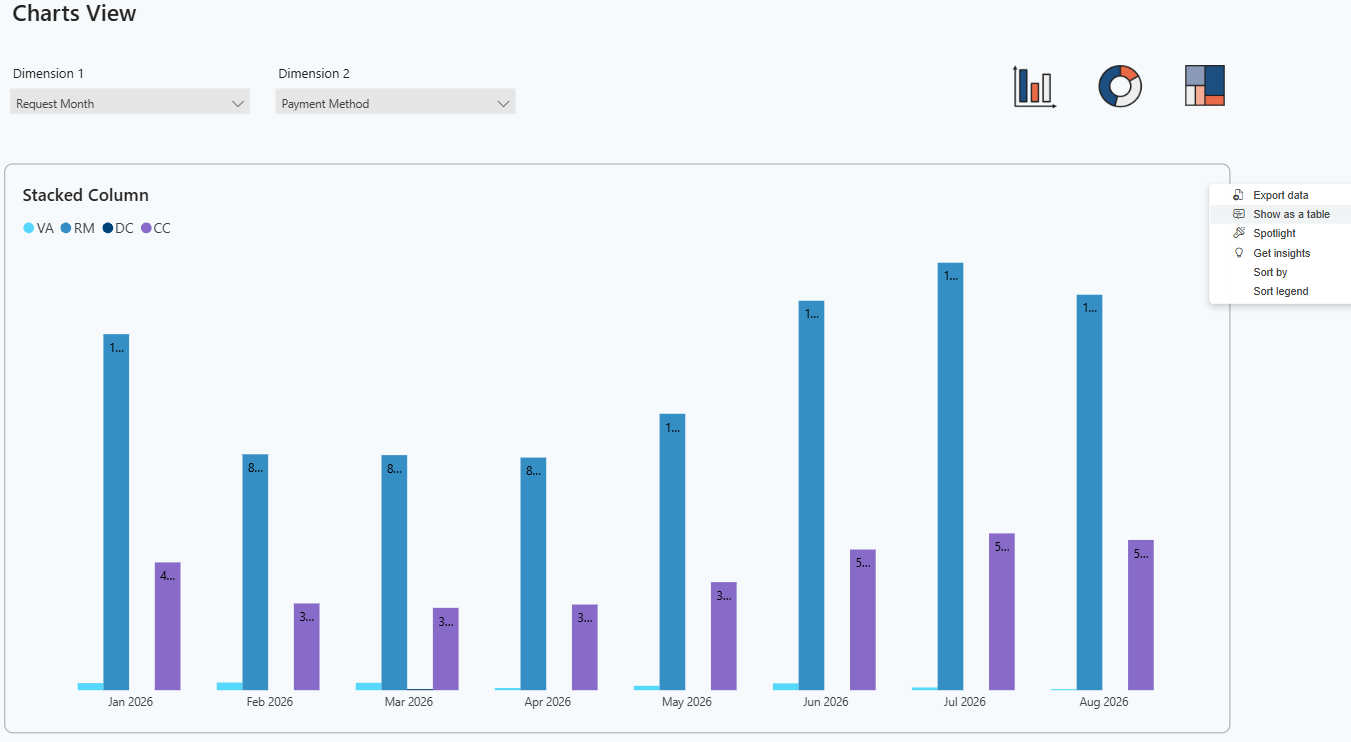
Figure 14: Donut chart visualization
.png)
Figure 15: Treemap chart visualization
.png)
Users can switch between graphical and tabular presentation modes using the available visualization controls.
More Options
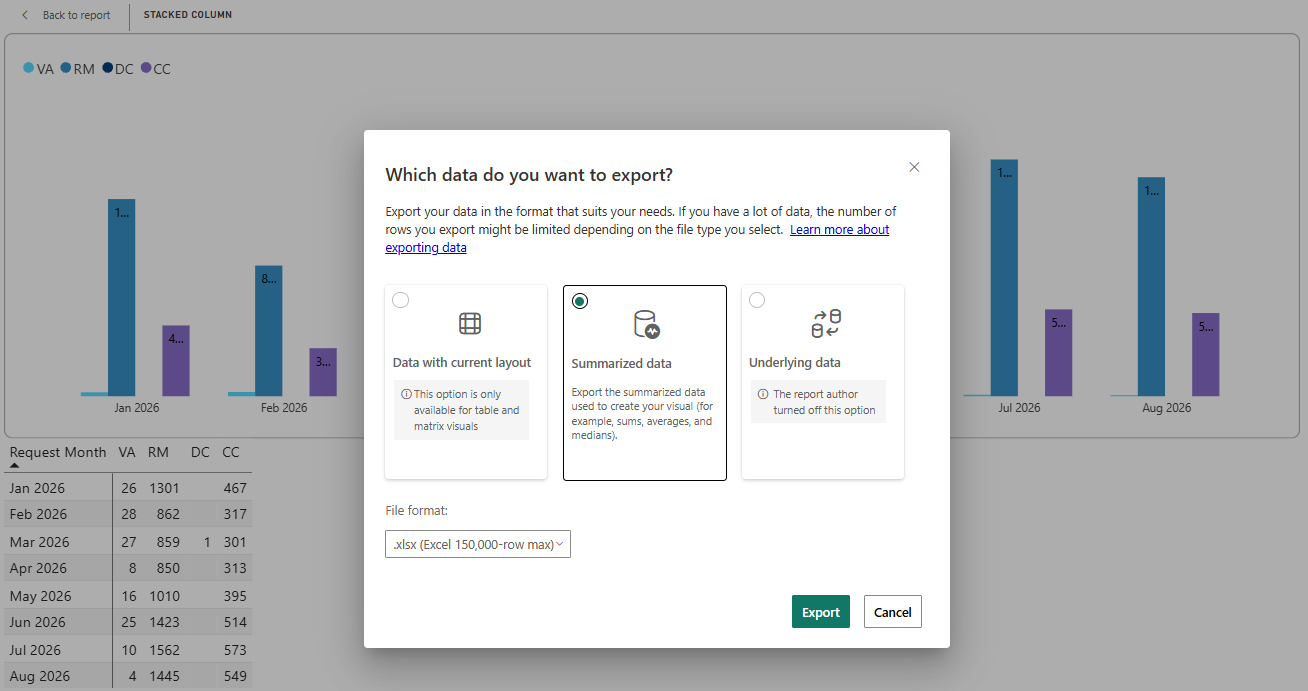
Additional actions for working with report data are available from the More options (...) menu in Matrix View and Chart View. Users can access options such as exporting report data or displaying chart data in a tabular format.
Export Data
The Export data option allows users to download the underlying report data for offline analysis, reporting, and sharing outside the Payment Profiling dashboard.
Figure 16: Export data from Table or Matrix View
 Export Data.png)
Figure 17: Export data from Chart View
Show as a Table
The Show as a table option displays the data underlying a chart in a tabular format. Users can switch between visual and tabular representations of the same data to review exact values and perform detailed analysis without modifying the report configuration.
Figure 18: Show as Table